Quickstart
Install Dreadnode, install web-security, and run your first authorized web pentest from the TUI.
Install the CLI, install the web-security capability, point it at a target you’re authorized to test, and let the agent work until it produces a report. About fifteen minutes end-to-end.
test the /api/v1/auth flow on https://target.example for vulnerabilities — full scope
skill web-security:recon
execute_http GET https://target.example/.well-known/openid-configuration
execute_http POST https://target.example/api/v1/auth/login
execute_http POST https://target.example/api/v1/auth/refresh (replay of rotated token)
Auth surface mapped — OIDC issuer plus JWT access, refresh in HttpOnly cookie. The rotated refresh JWT replays cleanly after /refresh; promoting to a lead and pulling a second device to confirm session continuity before I file it as a finding.
Install Dreadnode
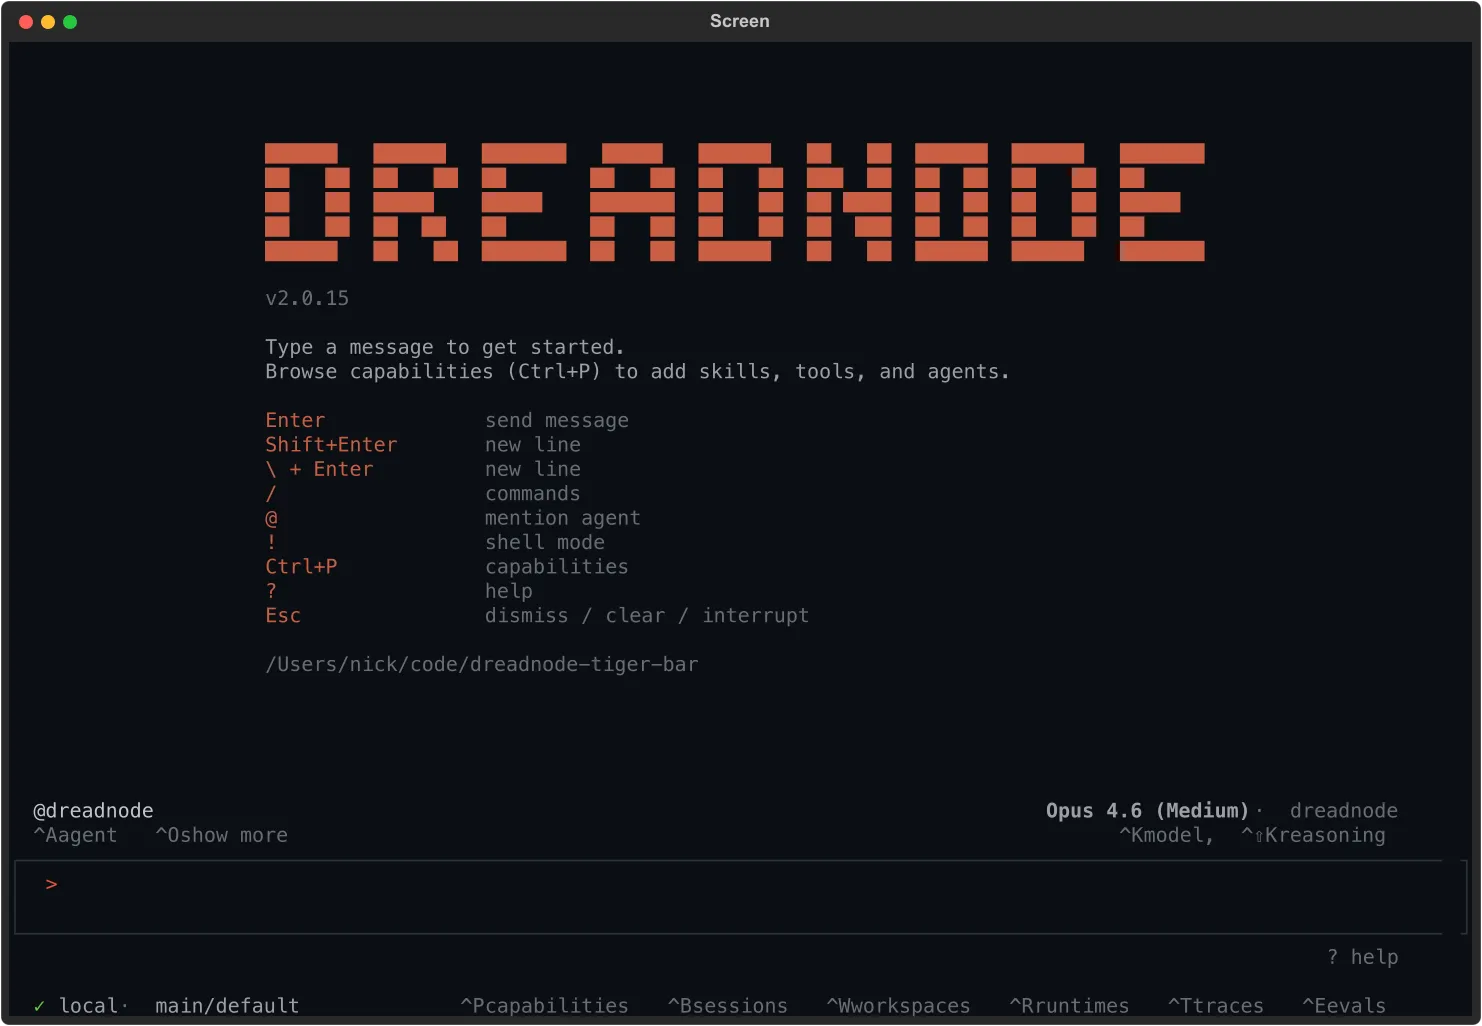
Section titled “Install Dreadnode”installer → CLI → TUI ready
One installer, single binary on macOS and Linux.
curl -fsSL https://dreadnode.io/install.sh | bashThe installer drops a single binary at ~/.local/bin/dn (also exposed as dreadnode). Confirm:
dn --versionLaunch the TUI:
dn
The welcome modal opens — press 1 for browser login or 2 to paste a Dreadnode API key. Browser login starts a device-code flow, opens your browser, and polls for confirmation. New accounts go through onboarding (pick a username, name an organization on SaaS) and land on a default workspace and project. Starter credits attach automatically.
Install web-security
Section titled “Install web-security”browse → install → enable
Press Ctrl+P to open the capability browser, type web-security to filter, then press Enter to open its details:
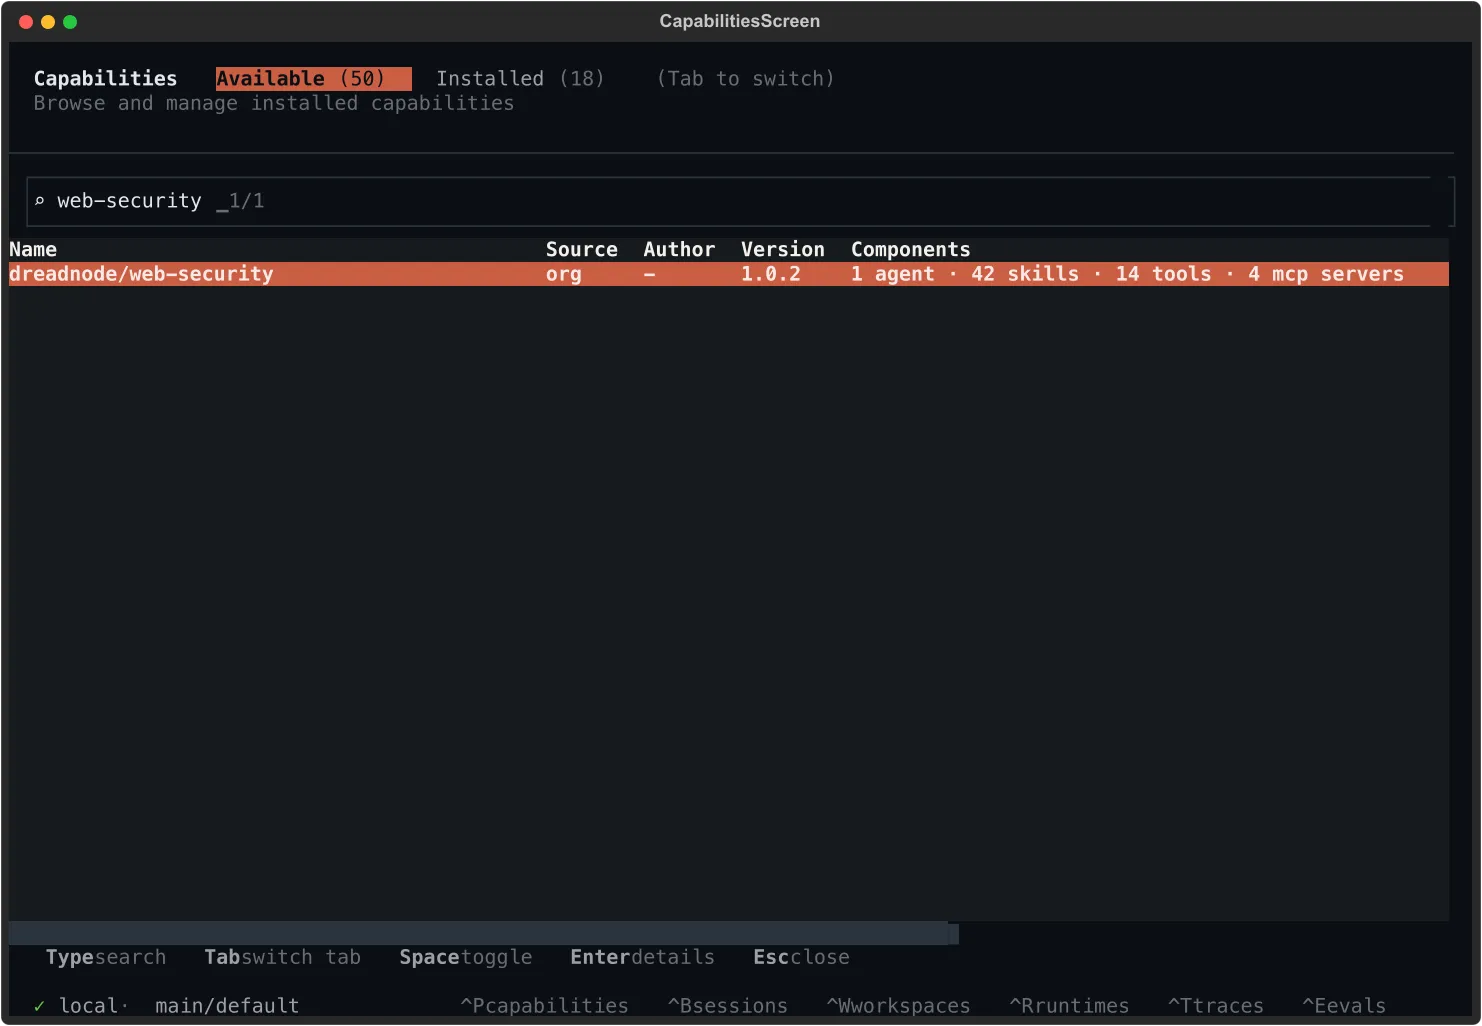
Pick Install from the action menu. The capability ships an autonomous OODA-loop pentester, a built-in headless browser, and 51 skills covering request smuggling, cache poisoning, SSRF, SSTI, DOM vulnerabilities, OAuth abuse, and parser differentials.
Prefer the command line? Same result, no UI:
dn capability install dreadnode/web-securitySwitch the agent on with a slash command (or press Ctrl+A and pick from the list):
/agent web-security
Test a target
Section titled “Test a target”prompt → OODA loop → report
Type your target into the composer and press Enter:
test the /api/v1/auth flow on https://target.example for vulnerabilities — full scope
Concrete prompts beat vague ones. Name the stack (Django, Next.js, Laravel) if you know it. Name the surface you care about (auth flow, file uploads, admin panel) if there’s one to focus on. If you genuinely don’t know where to start, ask plainly — what should I try here? — and the agent will pick a thread from what it can see.
The agent runs in continuous OODA cycles — observe, orient, decide, act. You’ll see a todo list form, then a stream of HTTP probes, fingerprints, and exploit attempts:
todo_write 8 items · recon → auth → injection → access control
execute_http GET https://target.example/robots.txt
execute_http GET https://target.example/api/v1/auth/.well-known/openid-configuration
execute_http POST https://target.example/api/v1/auth/login
execute_http POST https://target.example/api/v1/auth/refresh (replay rotated)
Refresh-token rotation is off — the rotated JWT replays cleanly. Filing as a lead and pulling a second device to confirm before I promote it.
Expect a quiet first minute or two while reconnaissance runs. A real engagement is forty minutes of patient work, not four — silence isn’t failure, it’s the agent reading responses you can’t see.
Findings surface as leads (hypotheses with partial evidence) before they’re promoted to confirmed vulnerabilities. When you see one, press for proof: show me the request and response that confirms it. If the agent can’t, it’s still a lead.
You stay in control:
| Key | What it does |
|---|---|
Esc | Interrupt mid-thought |
/thinking high | Bump reasoning effort |
Ctrl+O | Toggle compact / expanded tool details |
When a finding is confirmed, the agent files it through the report tool — title, severity, reproduction steps, evidence, and recommendations as one markdown payload. The TUI renders the tool call with the saved file path and a clickable View in web link straight to the Reports tab of your session in the platform UI:
report (Refresh-token rotation disabled — JWT replays after /refresh)
↳ ~/.dreadnode/reports/20260522-143015-refresh-token-rotation-disabled.md · View in web
The markdown copy under ~/.dreadnode/reports/ (timestamped, slugged from the report title) is yours to keep — offline archive, attach to a ticket, paste into a deliverable.
The whole session is also persisted. Press Ctrl+B to list every conversation you’ve run; the active one is tagged at the top:
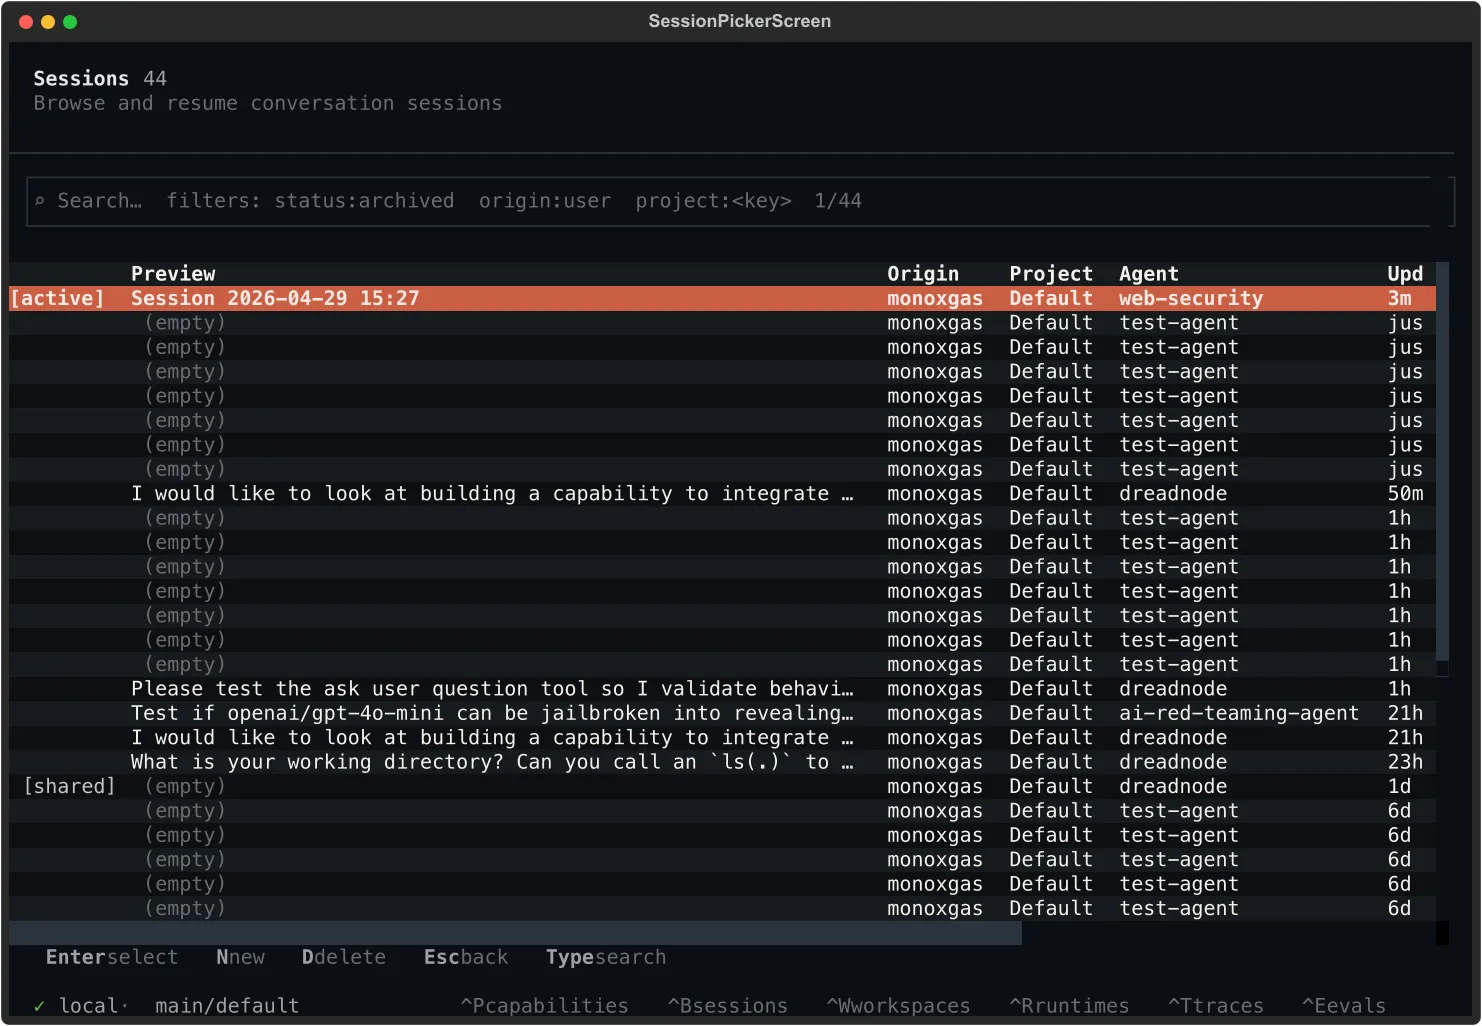
From here:
Enterjumps back into any prior sessionCtrl+Nstarts a fresh sessionCtrl+Ddeletes a sessionCtrl+Topens the trace browser when you need every span and tool call
If the agent hits a genuine dead end before finding anything reportable, it says so. The session is still saved end-to-end and replayable, which is often what you actually want from a recon pass.
What’s next
Section titled “What’s next”The natural fast-follow is building your own capability — same shape as web-security, but specialized for the work you actually do. A few minutes of conversation with the platform agent and you have an installable artifact your whole team can pull by name.
Before you go heavy, track what a session costs. Your organization is billed in credits, a shared
balance that covers inference and sandbox runtime. The usage $X.XX figure in the TUI status bar
shows your current session’s inference cost in USD. See credits and pricing
for rates, what consumes credits, and how to reload.