Monitoring evaluations
Watch evaluation progress, pass rate, and per-run state live from the Dreadnode TUI.
Press Ctrl+E (or type /evaluations) in the TUI to open the evaluations screen — the live
control-plane view for runs in flight.
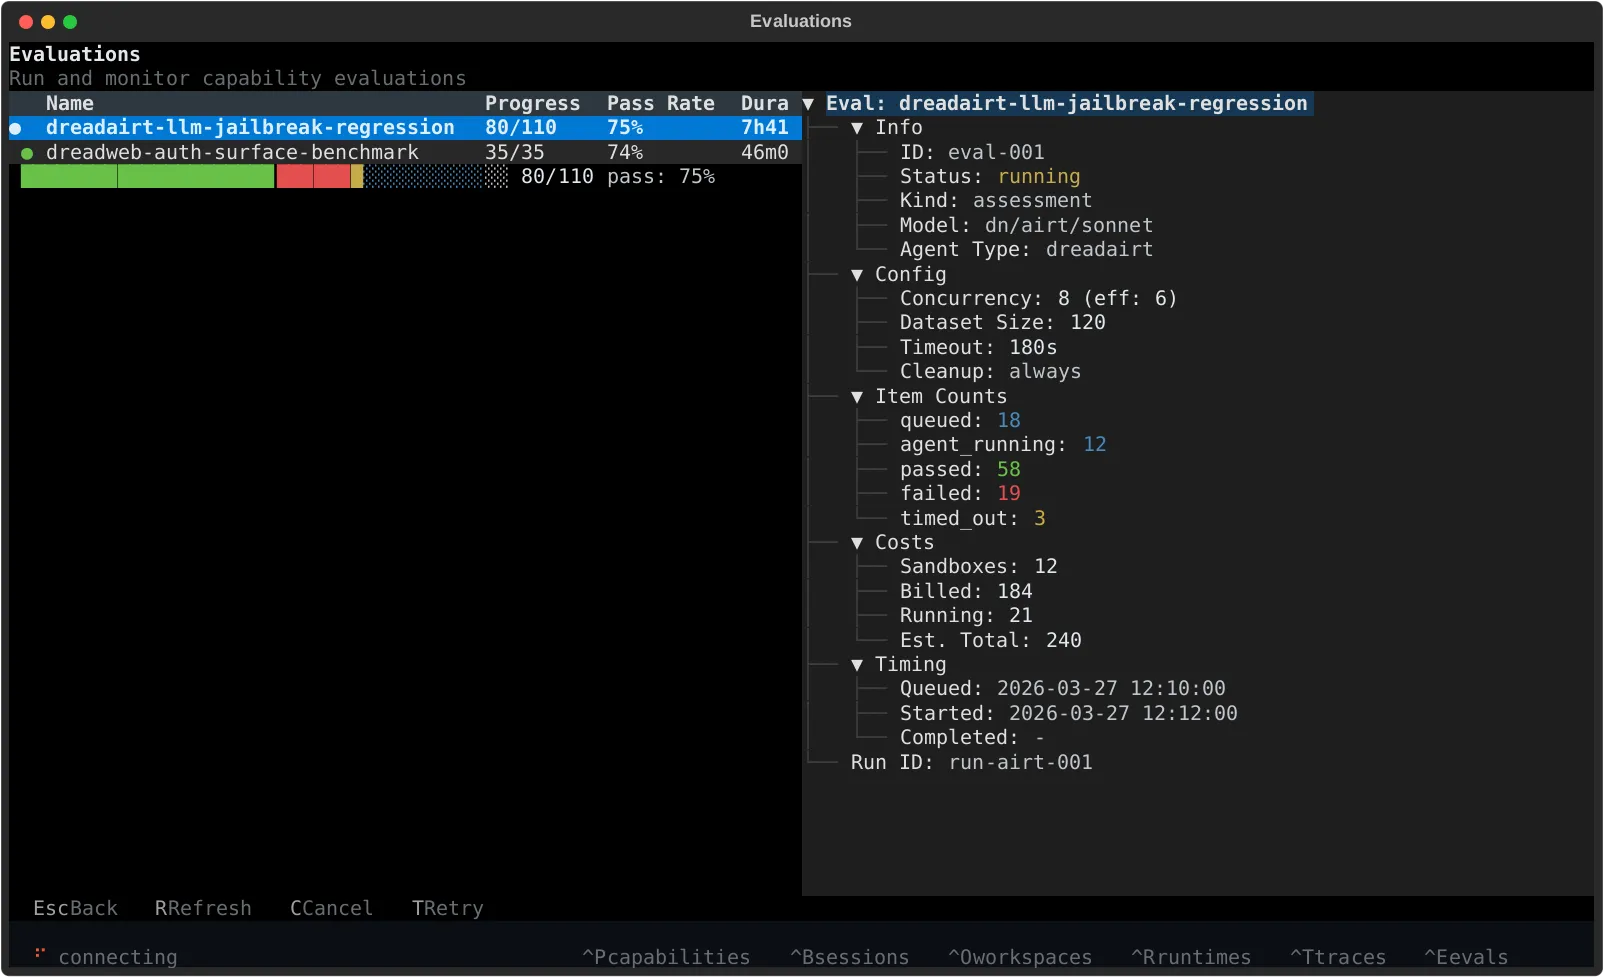
The screen is split three ways:
- Left — evaluation table with status, progress, pass rate, duration, and creation time
- Bottom left — progress bar for the selected run
- Right — detailed metadata for the highlighted evaluation
The whole screen auto-refreshes every 5 seconds, so it works as a live view while a job is still moving.
Detail view
Section titled “Detail view”The detail panel shows what you usually want mid-run:
- job status
- model and capability
- concurrency and dataset size
- sample counts across passed, failed, timed out, and in-progress states
- billed, running, and estimated credits
- timing metadata and run ID
It also surfaces the per-item states (claiming, provisioning, agent_running,
agent_finished, verifying) so you can tell whether a run is stuck on compute setup, agent
execution, or task verification.
Controls
Section titled “Controls”| Key | Action |
|---|---|
Ctrl+E | Open the evaluations screen |
r | Refresh |
c | Cancel the selected evaluation |
t | Retry the selected evaluation |
Esc | Close the screen |
t is most useful after a terminal run — it requeues only the samples that ended in failed,
timed-out, cancelled, or infrastructure-error states.