Monitoring
Watch a training job's metrics, logs, and status from the App's Training view.
The App’s Hosted training jobs view is the live window onto a training run — loss curves, reward trajectories, learning-rate schedule, structured logs, and one-click cancel / retry.
Open it from the left sidebar under Training. The URL lands at
/<org>/training?workspace=<workspace>&project=<project> with the job list on the left and the
detail pane on the right.
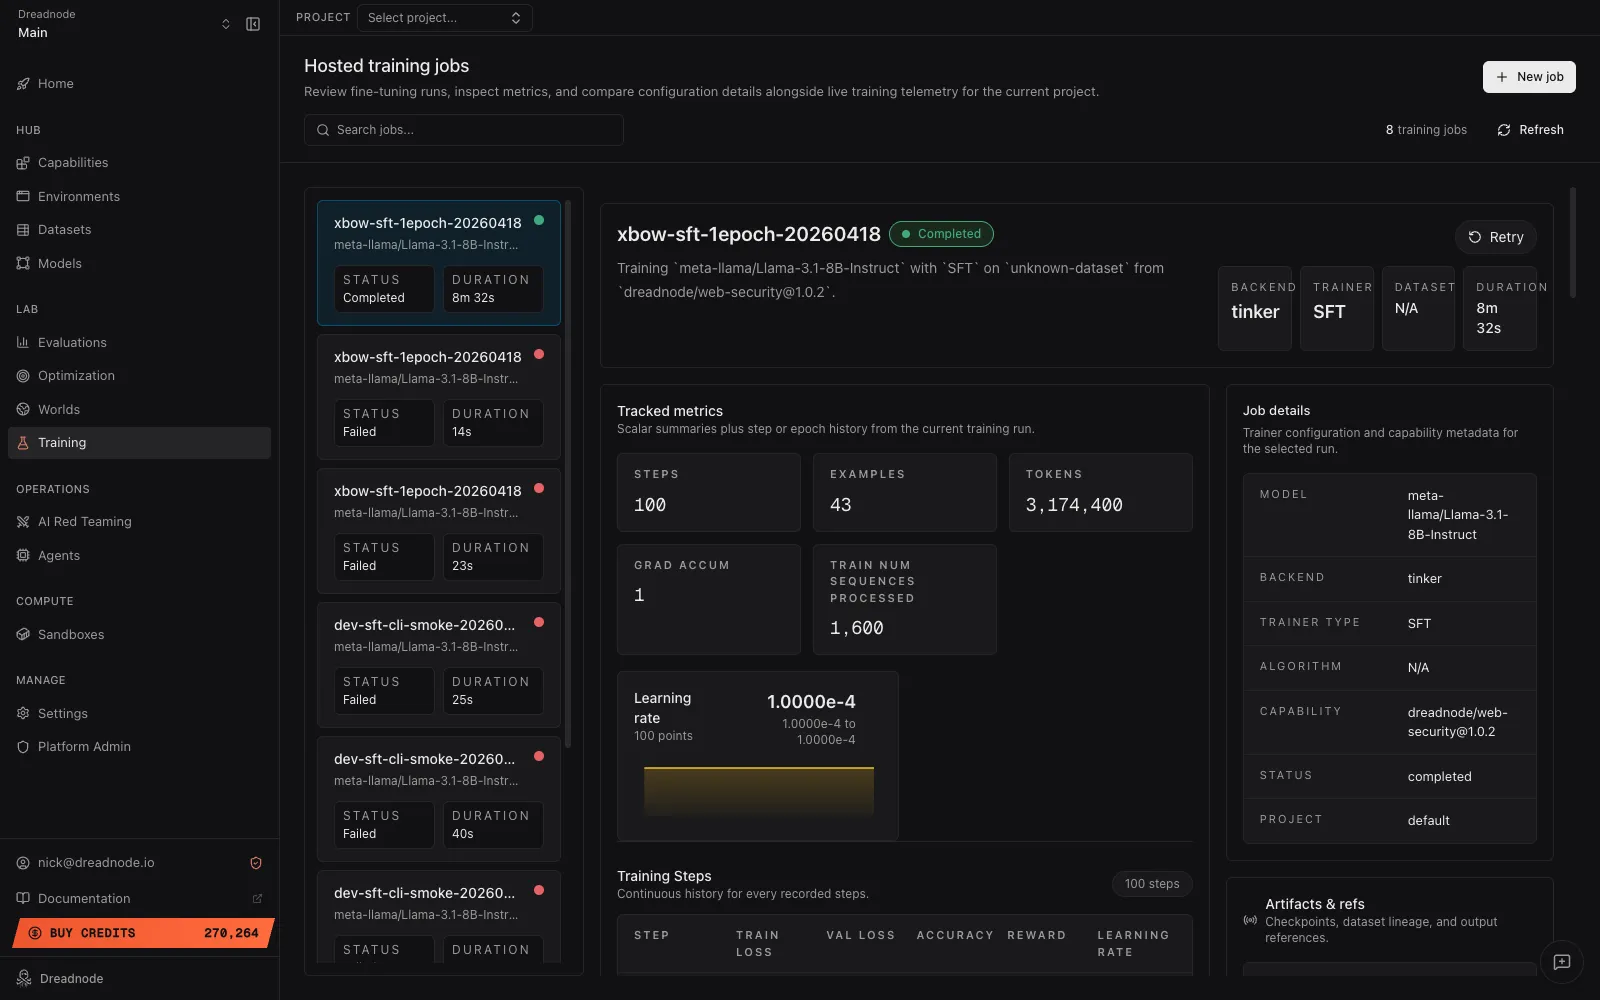
Job list
Section titled “Job list”The left sidebar lists every training job in the active workspace + project. Each row shows:
- Name — the optional display name or the backend/trainer pair.
- Model — the base model being adapted.
- Status — a coloured dot plus the status label.
- Duration — wall-clock time since the job started.
A search box filters by name, ID, status, model, dataset, trainer type, or backend. Pagination loads in batches of 100; click through to load more. + New job in the top-right opens the CLI-submission guide.
Detail pane
Section titled “Detail pane”Selecting a job populates the right-hand detail pane:
- Header — job name, status badge, and a one-line summary of the form “Training
<model>with<trainer>on<dataset>from<capability>@<version>.” Live RL jobs also surface the world goal when one was provided. - Action buttons — Cancel (while the job is
queuedorrunning) or Retry (on terminal jobs). - Summary stats — four tiles: backend, trainer, dataset, duration.
- Tracked metrics — scalar tiles followed by the four metric charts and a step-by-step history table. See below.
- Job details card — model, backend, trainer type, algorithm, capability version, status, run ref, project ref.
- Artifacts & refs card — the job’s
artifact_refsJSON (minus internal worker fields). - Live logs — structured log entries with timestamp, level, message, and an optional data payload.
Tracked metrics
Section titled “Tracked metrics”The scalar tiles above the charts change per run, but typically include steps, examples,
tokens, grad accum, and — when populated — best and latest training loss, eval loss, and
mean reward.
Up to four echarts instances render whenever the job’s metrics carry the relevant series:
| Chart | Reads | Notes |
|---|---|---|
| Loss | train_loss, val_loss | SFT only today; the validation line only appears when an eval dataset was used. |
| Learning rate | learning_rate | Log-scaled y-axis. SFT only today. |
| Accuracy | accuracy | Renders only when a trainer emits an accuracy series. The Tinker SFT and RL trainers don’t emit it today. |
| Reward | reward | Renders only when a trainer emits a step-keyed reward series. The Tinker RL trainer emits scalar train/reward_mean only — no step array — so this chart is empty for current Tinker jobs. |
The x-axis uses steps when present, falling back to epochs. Charts whose series are all
missing or empty aren’t rendered — you won’t see an empty box.
Beneath the charts, a History table lists every step with its train loss, val loss, accuracy, reward, and learning rate, so you can scrub through the full run.
Actions
Section titled “Actions”Cancel — same behavior as dn train cancel. Queued jobs
flip to cancelled immediately; running jobs enter a cancel-requested state until the worker
finishes cleanup.
Retry — same behavior as client.retry_training_job. Terminal jobs only; metrics and
artifacts are cleared before requeue.
Where to go next
Section titled “Where to go next”- Running training jobs covers the same lifecycle from the CLI and SDK.
- Outputs describes the artifacts, metrics, and logs the Training view is reading from.